
The Points report is the raw position log behind everything you see on the map. Every time a tracking device sends in a position — a “point” — PosiTrace records where the unit was, when, how fast it was moving and what voltage the device was seeing. This report lists those points one row at a time, so you can verify exactly where a vehicle was at any moment, check that a device is reporting properly, or export raw coordinates for your own analysis.
When to use the Points report
- Prove where a vehicle was. Every row is a timestamped position straight from the device — useful for disputes, claims and customer questions.
- Check that a device is reporting. Regular points a few minutes apart mean a healthy device; long gaps or missing hours point to power, coverage or installation issues.
- Watch device voltage. The Voltage column shows the supply voltage at each point, which helps spot weak batteries or wiring problems developing over a day.
- Export raw GPS data. The latitude and longitude columns give you clean coordinates for spreadsheets or your own tools — generate the report as excel (xlsx) or csv.
Where to find it
From the top navigation bar, open Reports and choose Points under the Diagnostics & Compliance column.
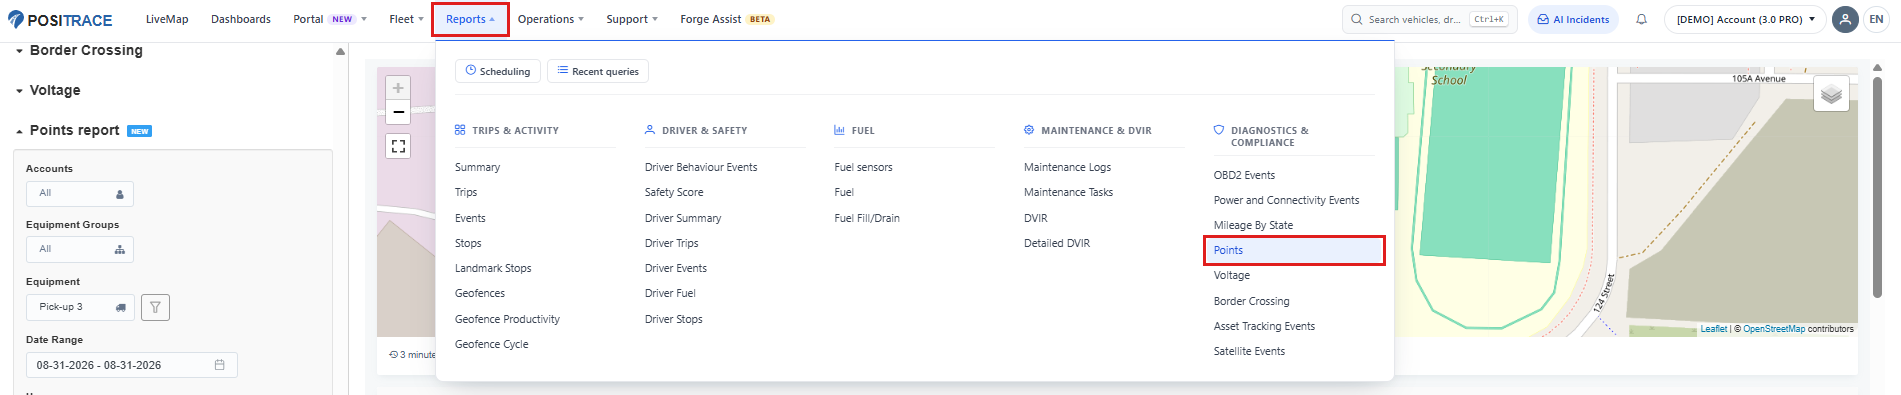
Figure 1. Reports › Diagnostics & Compliance › Points. The report opens in the panel on the left, with your recent queries listed underneath.
|
TIP Check that the correct account is selected in the account switcher at the top right before you start. The report only offers equipment from the accounts you have access to. |
Setting up the report
Fill in the panel on the left, then click Generate Report.
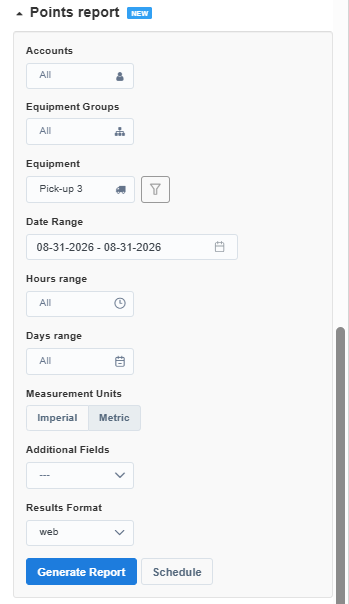
Figure 2. The Points report panel. Only Equipment really needs your attention — everything else has a sensible default.
Choose the equipment
- Accounts — narrows the report to specific accounts. Leave on All if you manage a single account.
- Equipment Groups — limits the list to one or more groups, for example a region or yard.
- Equipment — the vehicles or assets to report on. The funnel button beside the field filters the equipment list so long fleets are easier to pick from.
Choose the time window
- Date Range — the calendar includes one-click presets: Today, Yesterday, Last 7 days, Last 14 days, Current week, Current bi-week, Current month, Previous week, Previous bi-week and Previous month.
- Hours range — restricts the report to selected one-hour blocks (00:00 - 01:00 through 23:00 - 24:00). Pick several blocks to build a shift — overnight only, for example. Empty means all hours.
- Days range — restricts the report to selected days of the week. Empty means all days.
|
KEEP THE RANGE SHORT A device can report a point every few minutes, so a single vehicle can produce hundreds of rows per day. Start with one day for one vehicle and widen from there — a month across a whole fleet makes a very large report that is slow to generate and hard to read. |
Output options
- Measurement Units — Imperial shows speed in mph, Metric in km/h.
- Additional Fields — adds your account’s custom equipment fields as extra columns, so you can slice the export by attributes such as load type or operating environment. The list reflects the custom fields defined on your account.
- Results Format — web shows the report on screen with a map; pdf, excel (xlsx) and csv produce a file; email sends the results to you.
Reading the results
In the web format the results open with a map on top and the points table below it. The numbered circle on the map is a cluster — it counts the points at that spot, and zooming in breaks it apart into individual positions.
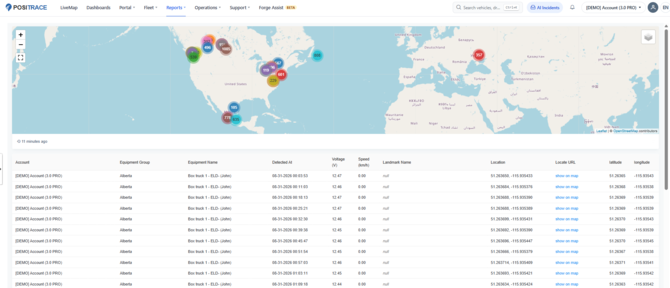
Figure 3. A one-day Points report for a single vehicle. Each row is one position report from the device, in chronological order.
| Column | What it shows |
|---|---|
| Account | The account the unit belongs to — useful when the report spans several accounts. |
| Equipment Group | The group the unit is in. |
| Equipment Name | The vehicle or asset that sent the point. |
| Detected At | Date and time the device recorded the position. |
| Voltage (V) | Supply voltage the device measured at that moment. A steady reading around vehicle battery level is normal; a sagging trend can flag a battery or wiring problem. |
| Speed | Speed at that point, in km/h or mph depending on Measurement Units. 0.00 means the unit was stationary. |
| Landmark | If the coordinates point towards an existing landmark, it will show Landmark name. |
| Location | The full-precision coordinates of the point, as latitude, longitude. |
| Locate URL | show on map — opens that exact position on the map. |
| latitude / longitude | The same coordinates as separate columns, ready for spreadsheets and mapping tools. |
|
GOOD TO KNOW
|
Running it automatically
Click Schedule next to Generate Report to have the Points report generated on a recurring schedule and delivered to you — handy for a daily device-health check on critical units. Existing schedules are managed under Reports › Scheduling.
Frequently asked questions
How is this different from the Trips report?
Trips summarizes movement into journeys with a start, an end and a distance. Points is the raw feed underneath — every individual position, including all the time a vehicle spends parked. Use Trips to see where a vehicle went; use Points when you need the exact positions and timestamps behind it.
Why are there so many rows?
Devices report on a regular interval whenever they have power, including while parked. That is what makes the report useful for verifying device health — but it also means the row count grows quickly. Narrow the date range, or use Hours range and Days range to focus on the time you care about.
There is a gap of several hours with no points. Is that a problem?
It can be. Common explanations, roughly in order: the device lost power, the vehicle was out of cellular coverage (points normally catch up once coverage returns), or the device has a fault. If gaps recur on the same unit, contact PosiTrace Support with the equipment name and the report showing the gap.
Why does the Speed column say km/h when I want mph?
The column follows the Measurement Units toggle in the panel — set it to Imperial and generate the report again.
Can I get the data into Excel?
Yes — set Results Format to excel (xlsx) or csv before generating. The latitude and longitude columns come through as plain numbers, ready to use.
Still need a hand?
If you cannot access a report, please contact PosiTrace Support or your Account Manager, as access may depend on your account's subscription.
To help us assist you faster, please provide the vehicle name, Report Code, and the date range you used.
Thank you!