
The OBD2 Events report lists the diagnostic trouble codes (DTCs) your vehicles' engine computers raised during a period — the same codes that switch on the "check engine" light. PosiTrace reads them through the vehicle's OBD2 port or CAN connection and records which code appeared, what it means, when it started, when it cleared and how long it stayed active. Use it to catch mechanical problems early, decide which vehicles go to the shop first, and give your mechanic the exact codes behind a warning light.
When to use the OBD2 Events report
- Catch problems before they become breakdowns. A code often appears days or weeks before a part fails — a weekly look lets you book the repair on your schedule, not at the roadside.
- Decide what goes to the shop first. Most Affected Equipment and Recurring Diagnostic Issues show which vehicles and which codes keep coming back.
- Spot fleet-wide patterns. The same code on many units can point to a common part, a fuel batch or a model-specific issue.
- Give your mechanic the facts. Each row has the code, its description and the exact start and end time — generate the report as excel (xlsx) or csv to share it.
Where to find it
From the top navigation bar, open Reports and choose OBD2 Events under the Diagnostics & Compliance column.
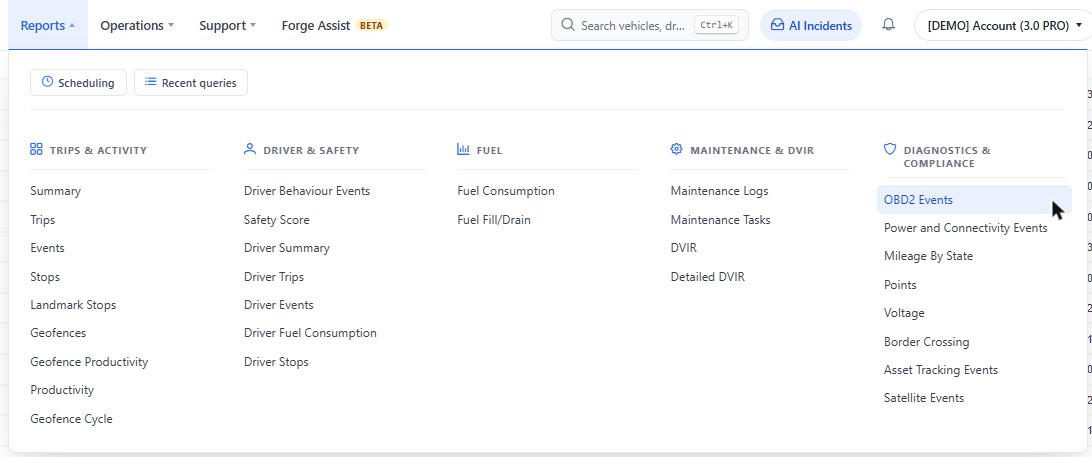
Figure 1. Reports › Diagnostics & Compliance › OBD2 Events. The report opens in the panel on the left, with your recent queries listed underneath.
|
TIP Check that the correct account is selected in the account switcher at the top right before you start. Diagnostic codes only come from vehicles whose tracking device reads engine data through the OBD2 port or CAN bus — vehicles with other devices will not appear in this report. |
Setting up the report
Fill in the panel on the left, then click Generate Report.
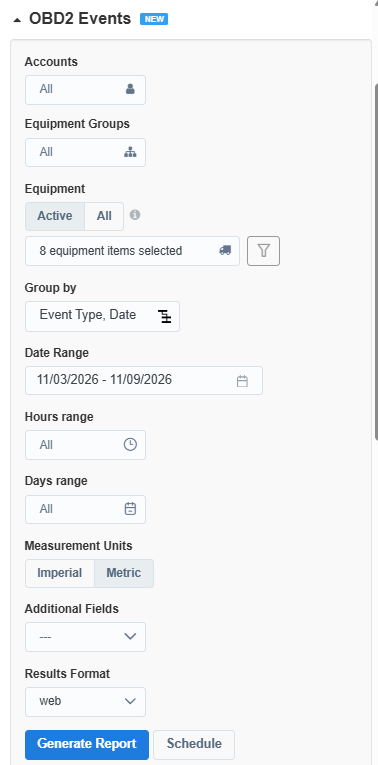
Figure 2. The OBD2 Events report panel. Pick your equipment and date range — everything else has a sensible default.
Choose the equipment
- Accounts — narrows the report to specific accounts. Leave on All if you manage a single account.
- Equipment Groups — limits the list to one or more groups, for example a region or yard.
- Equipment — the vehicles to report on. Active lists the equipment currently in service; All also includes inactive equipment. The funnel button beside the field filters the equipment list so long fleets are easier to pick from.
Choose the time window
- Date Range — the calendar includes one-click presets: Today, Yesterday, Last 7 days, Last 14 days, Current week, Current bi-week, Current month, Previous week, Previous bi-week and Previous month.
- Hours range — restricts the report to selected one-hour blocks (00:00 - 01:00 through 23:00 - 24:00). Empty means all hours.
- Days range — restricts the report to selected days of the week. Empty means all days.
|
START WITH A WEEK A faulty sensor can switch a code on and off many times a day, so one vehicle can log hundreds of events in a week. Last 7 days is a good starting point — widen the range once you know which vehicles you are looking at. |
Output options
- Group by — chooses how results are grouped: Event Type, Date (by diagnostic code, then by day — the default) or Date, Event Type. The on-screen dashboard looks the same with either choice.
- Measurement Units — Imperial or Metric. Diagnostic codes and durations are the same either way.
- Additional Fields — adds your account's custom equipment fields as extra columns, so you can sort or filter the export by attributes such as load type or operating environment. The list reflects the custom fields defined on your account.
- Results Format — web shows an interactive dashboard on screen; pdf, excel (xlsx) and csv produce a file; email sends the results to you.
Reading the results
In the web format the results open as a dashboard: summary tiles and charts at the top, then tables that break the codes down by vehicle, and the full list of events at the bottom.
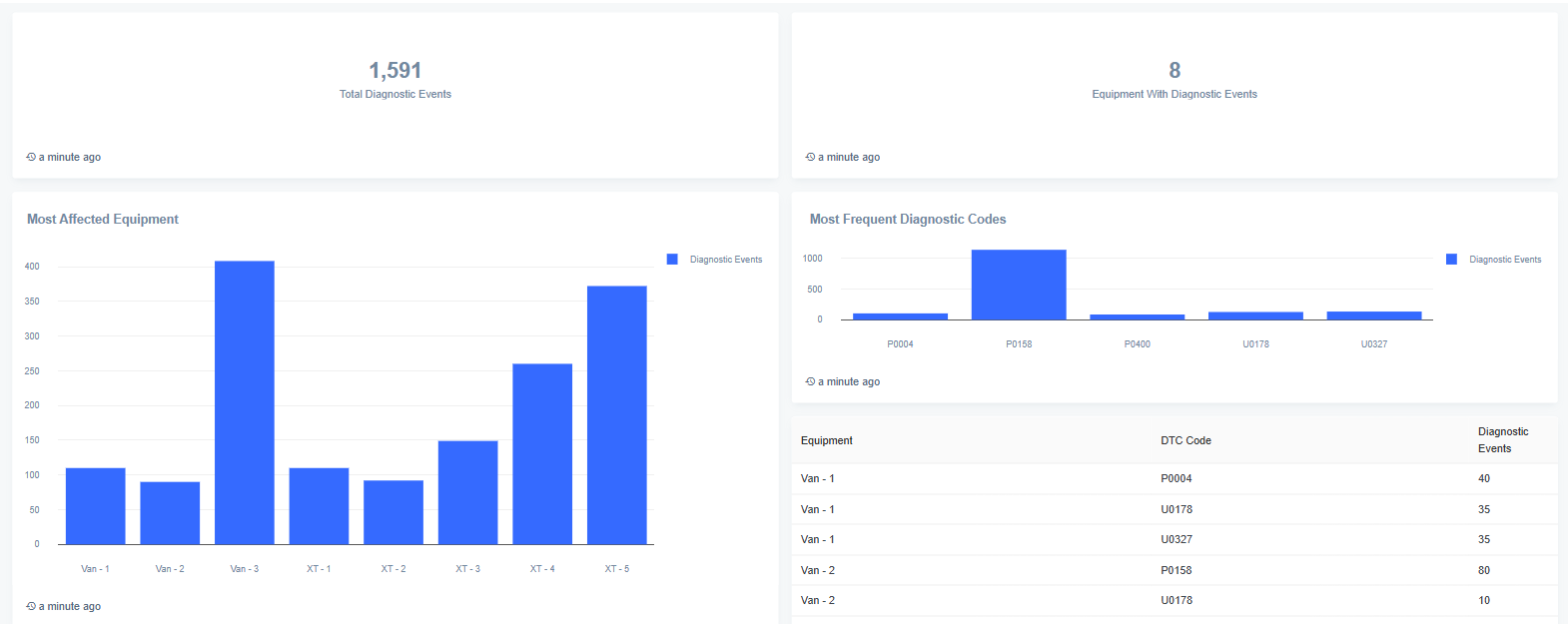
Figure 3. The top of a one-week OBD2 Events report for eight vehicles: the summary tiles, the vehicles with the most events and the most frequent codes.
The summary tiles
- Total Diagnostic Events — how many times a diagnostic code was raised in the period, across all selected equipment.
- Equipment With Diagnostic Events — how many of the selected vehicles raised at least one code.
Most Affected Equipment
One bar per vehicle, showing its number of diagnostic events. The tallest bars are the vehicles to look at first.
Most Frequent Diagnostic Codes
One bar per code, showing how often it was raised across the fleet. The table beside it lists each vehicle and code pair with its number of Diagnostic Events; use the page numbers under it to see more rows.
Recurring Diagnostic Issues
The vehicle and code combinations that came back most often in the period, highest first, with a plain-language description of each code.
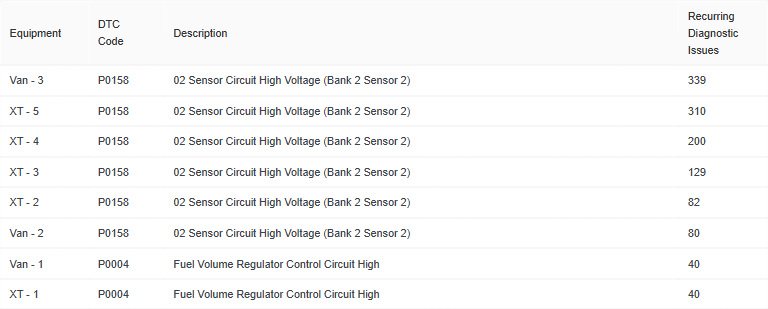
Figure 4. Recurring Diagnostic Issues. Here one oxygen-sensor code (P0158) is behind most of the week's events on several vehicles.
Diagnostic Events Over Time
Two line charts show the trend day by day: Diagnostic Events Over Time for the whole selection, and Diagnostic Events Over Time by Equipment with one line per vehicle. A line that keeps climbing points to a problem that is getting worse; a line that drops to zero after a shop visit confirms the repair worked.
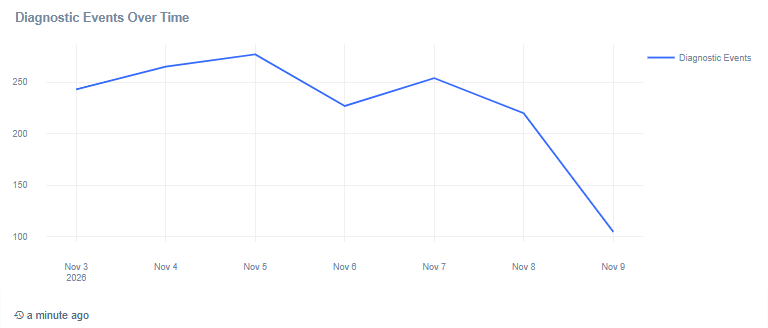
Figure 5. Diagnostic Events Over Time for the whole selection.
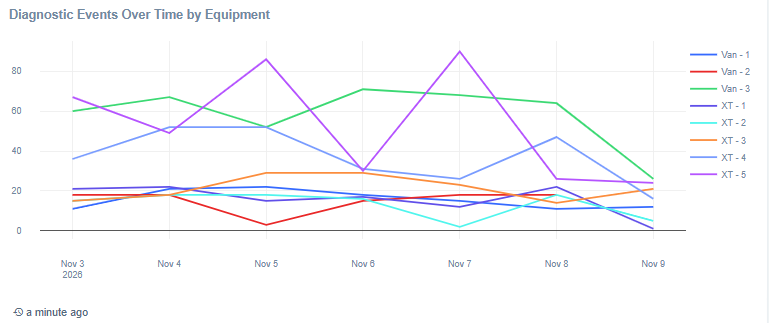
Figure 6. Diagnostic Events Over Time by Equipment — one line per vehicle.
The event details table
At the bottom of the dashboard, every diagnostic event is listed one row at a time. Use the page numbers under the table to move through long lists.
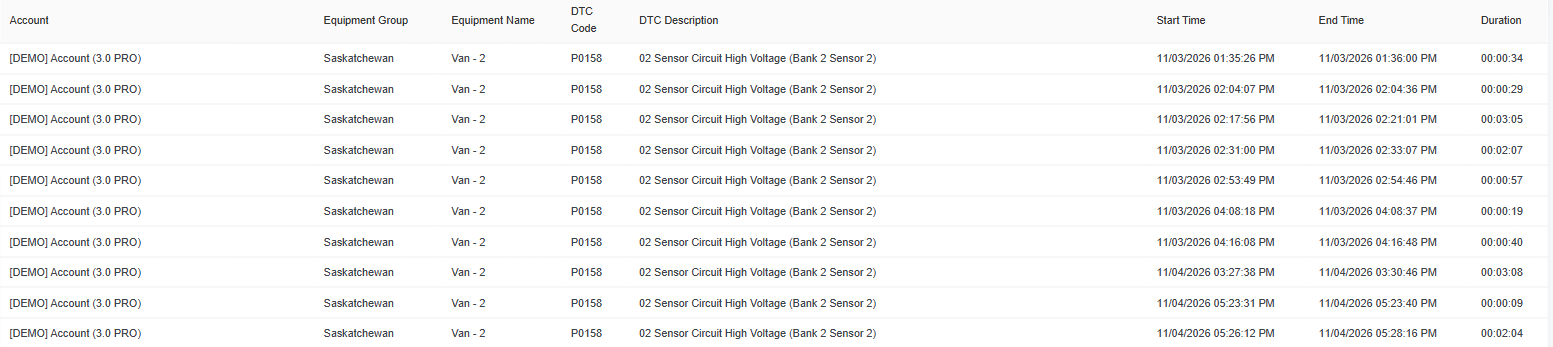
Figure 7. The event details table. Each row is one time a code switched on and then cleared.
| Column | What it shows |
|---|---|
| Account | The account the vehicle belongs to — useful when the report spans several accounts. |
| Equipment Group | The group the vehicle is in. |
| Equipment Name | The vehicle that raised the code. |
| DTC Code | The diagnostic trouble code, for example P0158. The first letter tells you the system: P powertrain (engine and transmission), B body, C chassis, U network and communication between the vehicle's computers. |
| DTC Description | What the code means in plain language, for example "O2 Sensor Circuit High Voltage (Bank 2 Sensor 2)". |
| Start Time | Date and time the code was first reported. |
| End Time | Date and time the code cleared. |
| Duration | How long the code stayed active, as hours:minutes:seconds. |
|
GOOD TO KNOW
|
Making the report useful
- Start with Recurring Diagnostic Issues. Codes that keep coming back on the same vehicle are the ones most likely to need a repair.
- Look at the duration. A code that stays active for hours or days is a stronger signal than one that appears for a few seconds and clears.
- Check after every repair. Run the report for the days after a shop visit — if the code returns, the problem was not fixed.
- Share it with your mechanic. An excel (xlsx) or csv export gives them the exact codes, descriptions and times.
Running it automatically
Click Schedule next to Generate Report to have the OBD2 Events report generated on a recurring schedule and delivered to you — a weekly report to your fleet or maintenance manager is a simple way to keep on top of new codes. Existing schedules are managed under Reports › Scheduling.
Frequently asked questions
What is a diagnostic trouble code (DTC)?
It is a standard code a vehicle's on-board computer stores when it detects a fault, such as a sensor reading out of range. The same codes are what a mechanic's scan tool reads. The report shows the code together with its description, so you do not need a scan tool to see what is going on.
Does a code mean the vehicle is unsafe to drive?
Not necessarily. Some codes are minor, such as a loose fuel cap; others need attention right away. Use the description as a guide and check with your mechanic. If the driver sees a flashing check engine light, the vehicle should be inspected as soon as possible.
A vehicle is missing from the report. Why?
Usually one of these: the vehicle did not raise any codes in the period, its tracking device does not read engine data from the OBD2 port or CAN bus, the device was not reporting, or the vehicle is filtered out — check Equipment Groups, Equipment and the Active / All toggle.
The vehicle was repaired, but the code still appears. Why?
The report shows history, so codes raised before the repair stay in it. Generate the report for the days after the repair: if no new events appear, the fix worked. If the code returns, the problem is still there.
Why does one code show a duration of several days?
The code stayed active for that whole time — the fault was present and was not cleared. If it started before your date range, the duration only counts the part inside the range.
Can this report be emailed automatically?
Yes — click Schedule instead of Generate Report, or set Results Format to email to receive a one-off copy.
Still need a hand?
If you cannot access a report, please contact PosiTrace Support or your Account Manager, as access may depend on your account's subscription.
To help us assist you faster, please provide the vehicle name, Report Code, and the date range you used.
Thank you!